Promontorio Silver Resource
PROJECT HIGHLIGHTS
- Over 65,000 metres of
drilling has delineated a resource estimate of
42.115 million tonnes containing 140.79 million ounces of silver equivalent in
the Measured & Indicated categories grading 104 g/t silver
equivalent and 14.57 million tonnes containing 39.78 million ounces of
silver equivalent in the Inferred category grading 84.9 g/t silver
equivalent (see table 2)
- A new 43-101 Resource Estimate for Promontorio including the La Negra deposit was filed November 2023, see above (Visit La Negra project page for its resource details). See table 2 for the combined resource.
- The Promontorio Silver
Resource is part of the Promontorio Mineral Belt which includes the La
Negra high grade silver project, located 7 kilometres north (of the
Promontorio Silver Resource)
- Advanced metallurgical test
work has allowed for the inclusion of gold in the mineral resources, which
has a significant impact on the silver equivalent grades and relative
ounces
- Drilling returned a series
of high-grade silver results from the NE zone, adjacent to the discovery
area
- The Promontorio Silver
Resource remains open for expansion in three directions and to depth
- Pan American Silver optioned the Promontorio Mineral Belt from 2016 to June 2019, and invested US$3.6 million in expenditures on advancing the project
View the full Promontorio-La Negra Resource Estimate 43-101 Report
OVERVIEW
The Promontorio Silver Resource is situated on Promontorio Mineral Belt Property that includes the La Negra silver discovery; located in the state of Sonora, Mexico. The Promontorio Silver Resource currently hosts a resource estimate of 42.115 million tonnes containing 140.79 million ounces of silver equivalent in the Measured & Indicated categories grading 104 g/t silver equivalent and 14.57 million tonnes containing 39.78 million ounces of silver equivalent in the Inferred category grading 84.9 g/t silver equivalent (see Table 1). Pan American Silver optioned the Promontorio Mineral Belt from 2016 to June 2019, and invested US$3.6 million in expenditures on advancing the project.
Promontorio-La Negra Combined Resource Estimate
Table 1: 2023 Total Promontorio-La Negra Project Mineral Resource Estimate
|
In Situ Tonnage, Grades and Metal Content |
||||||||||||
|
Pit |
Class |
Tonnage (kt) |
AgEq |
Ag |
Au |
Pb (%) |
Zn (%) |
AgEq Metal (kOz) |
AG Metal (kOz) |
Au Metal (kOz) |
Pb (klb) |
Zn (klb) |
|
Promontorio |
Measured |
12,451 |
111.7 |
37.0 |
0.456 |
0.53 |
0.61 |
44,718 |
14,823 |
183 |
146,033 |
166,620 |
|
Indicated |
29,664 |
100.7 |
33.5 |
0.412 |
0.47 |
0.55 |
96,072 |
31,950 |
393 |
306,716 |
360,996 |
|
|
Meas+Ind |
42,115 |
104.0 |
34.5 |
0.425 |
0.49 |
0.57 |
140,790 |
46,773 |
575 |
452,748 |
527,616 |
|
|
Inferred |
14,575 |
84.9 |
27.9 |
0.348 |
0.42 |
0.45 |
39,782 |
13,069 |
163 |
136,241 |
143,632 |
|
|
La Negra |
Indicated |
5,285 |
129.3 |
126.3 |
0.067 |
|
|
21,966 |
21,454 |
11 |
0 |
0 |
|
Inferred |
1,257 |
114.8 |
112.2 |
0.060 |
|
|
4,639 |
4,536 |
2 |
0 |
0 |
|
|
Total |
Measured |
12,451 |
111.7 |
37.0 |
0.456 |
0.53 |
0.61 |
44,718 |
14,823 |
183 |
146,033 |
166,620 |
|
Indicated |
34,949 |
105.0 |
47.5 |
0.360 |
0.40 |
0.47 |
118,038 |
53,404 |
404 |
306,716 |
360,996 |
|
|
Meas+Ind |
47,400 |
106.8 |
44.8 |
0.385 |
0.43 |
0.50 |
162,755 |
68,227 |
587 |
452,748 |
527,616 |
|
|
Inferred |
15,832 |
87.3 |
34.6 |
0.325 |
0.81 |
0.89 |
44,421 |
17,606 |
165 |
282,274 |
310,251 |
|
PROMONTORIO MINERAL RESOURCE ESTIMATE
The mineral resource estimates (“MRE”) have been prepared by Sue Bird, M Sc., P.Eng., Geological and Mining Engineer of by Moose Mountain Technical Services ("MMTS") in accordance with NI 43-101 standards (May 9, 2016), CIM Definition Standards (May 19, 2014) with guidance from CIM Best Practice Guidelines (November 29, 2019).
Table 2: 2023 Mineral Resource Estimate for the Promontorio Deposit
|
Class |
Cutoff |
In situ Tonnage, Grade and Metal Content |
||||||||||
|
AgEq |
Tonnage (kt) |
AgEq |
Ag |
Au |
Pb |
Zn |
AgEq Metal (kOz) |
AG Metal (kOz) |
Au Metal (kOz) |
Pb |
Zn |
|
|
Measured |
15 |
13,538 |
104.3 |
34.5 |
0.428 |
0.49 |
0.57 |
45,419 |
15,012 |
186 |
147,440 |
168,631 |
|
20 |
13,011 |
107.9 |
35.7 |
0.441 |
0.51 |
0.59 |
45,122 |
14,934 |
184 |
146,864 |
167,803 |
|
|
25 |
12,451 |
111.7 |
37.0 |
0.456 |
0.53 |
0.61 |
44,718 |
14,823 |
183 |
146,033 |
166,620 |
|
|
30 |
11,903 |
115.6 |
38.4 |
0.470 |
0.55 |
0.63 |
44,233 |
14,691 |
180 |
144,854 |
164,797 |
|
|
40 |
10,793 |
123.9 |
41.3 |
0.500 |
0.59 |
0.68 |
42,984 |
14,324 |
174 |
141,339 |
160,851 |
|
|
50 |
9,710 |
132.7 |
44.4 |
0.532 |
0.64 |
0.73 |
41,423 |
13,848 |
166 |
136,790 |
155,200 |
|
|
Indicated |
15 |
32,225 |
94.3 |
31.3 |
0.387 |
0.44 |
0.52 |
97,728 |
32,439 |
401 |
311,172 |
366,586 |
|
20 |
30,993 |
97.4 |
32.4 |
0.399 |
0.45 |
0.53 |
97,033 |
32,235 |
398 |
309,525 |
364,187 |
|
|
25 |
29,664 |
100.7 |
33.5 |
0.412 |
0.47 |
0.55 |
96,072 |
31,950 |
393 |
306,716 |
360,996 |
|
|
30 |
28,179 |
104.6 |
34.8 |
0.426 |
0.49 |
0.57 |
94,756 |
31,564 |
386 |
302,544 |
355,970 |
|
|
40 |
24,961 |
113.6 |
37.9 |
0.461 |
0.53 |
0.62 |
91,133 |
30,447 |
370 |
291,656 |
342,834 |
|
|
50 |
21,907 |
123.1 |
41.3 |
0.497 |
0.58 |
0.68 |
86,721 |
29,089 |
350 |
278,188 |
326,002 |
|
|
Measured + Indicated |
15 |
45,763 |
97.3 |
32.3 |
0.399 |
0.45 |
0.53 |
143,147 |
47,451 |
587 |
458,612 |
535,217 |
|
20 |
44,004 |
100.5 |
33.3 |
0.411 |
0.47 |
0.55 |
142,155 |
47,169 |
582 |
456,389 |
531,990 |
|
|
25 |
42,115 |
104.0 |
34.5 |
0.425 |
0.49 |
0.57 |
140,790 |
46,773 |
575 |
452,748 |
527,616 |
|
|
30 |
40,082 |
107.9 |
35.9 |
0.439 |
0.51 |
0.59 |
138,989 |
46,256 |
566 |
447,397 |
520,768 |
|
|
40 |
35,754 |
116.7 |
38.9 |
0.473 |
0.55 |
0.64 |
134,117 |
44,772 |
543 |
432,996 |
503,684 |
|
|
50 |
31,617 |
126.1 |
42.2 |
0.508 |
0.60 |
0.69 |
128,144 |
42,937 |
516 |
414,978 |
481,202 |
|
|
Inferred |
15 |
16,637 |
76.8 |
25.1 |
0.319 |
0.38 |
0.40 |
41,072 |
13,415 |
171 |
139,011 |
147,447 |
|
20 |
15,433 |
81.4 |
26.7 |
0.335 |
0.41 |
0.43 |
40,401 |
13,238 |
166 |
137,797 |
145,622 |
|
|
25 |
14,575 |
84.9 |
27.9 |
0.348 |
0.42 |
0.45 |
39,782 |
13,069 |
163 |
136,241 |
143,632 |
|
|
30 |
13,671 |
88.7 |
29.2 |
0.362 |
0.44 |
0.47 |
38,980 |
12,830 |
159 |
133,819 |
141,052 |
|
|
40 |
11,778 |
97.3 |
32.1 |
0.395 |
0.49 |
0.51 |
36,847 |
12,152 |
150 |
127,493 |
133,206 |
|
|
50 |
9,980 |
106.8 |
35.3 |
0.432 |
0.54 |
0.56 |
34,256 |
11,327 |
139 |
119,031 |
123,652 |
|
Notes to the 2023 Promontorio Resource Table:
1.Resources are reported using the 2014 CIM Definition Standards and were estimated using the 2019 CIM Best Practices Guidelines, as required by NI43-101
2.The base case Mineral Resource has been confined by "reasonable prospects of eventual economic extraction" shape using the following assumptions:
- Metal prices of US$22/oz Silver, US$1800/oz Gold, US$0.95/lb Lead and US$1.25/lb Zinc. Metallurgical recovery of 74% Silver, 70% Gold, 81% Lead and 88% Zinc
- Payable metal of 95% Silver, 99% Gold in dore 95% Au in Pb concentrate, 95% Lead and 85% Zinc. Lead payable assumes a concentrate grade of 65% Pb and a 3% unit deduction. Zinc payable assumes a concentrate grade of 52% Pb and an 8% unit deduction. Offsite costs (transport, smelter treatment and refining) of US$1.5/oz Silver and gold in the Pb concentrate, US$10 oz Gold, US$ 0.15/lb Lead and US$0.31/ lb Zinc. Lead offsite costs assume 100 $US/dmt transport, 100 $US/ dmt treatment. Zinc offsite costs assume 100 $US/dmt transport, 200 $US/ dmt treatment.
- Processing, General, and Administrative (“G&A”) costs of US$ 12/ tonne milled. Mining cost of US$2.00 / tonne
- 50 degree pit slopes with the 150% price case pit shell is used for the confining shape
3.The resulting NSR = Ag*US$0.63/g*74% + Au*US$56.71/g*70% + 22.0462*(Pb*US$0.77/lb*81% + Zn*US$ 0.80/lb*88%)
4.The specific gravity of the resource averages 2.79 and is calculated from the Lead and Zinc content. Non-mineralized material is assigned an SG of 2.73
5. Numbers may not add due to rounding.
Additional metallurgical test work has allowed for the inclusion of gold in the mineral resources, which has a significant impact on the AgEq grades and relative ounces.The following material changes incorporated into the updated resource estimation contributed to the significant increase in the mineral resource:
- The estimated Measured and Indicated gold resources contained within the mineralized diatreme system total 508,000 ounces with an additional 155,000 ounces Inferred.
Drilling data includes a total of 45,118 samples from 65,092 meters of drilling. Of the 45,118 samples in the database, 22,658 lie within the wireframes and were used in the resource estimation. Wireframes are three-dimensional closed solids constructed in Vulcan(tm) and based on a combination of logged geology and assay information. These wireframes limit the estimation.
Three-dimensional wireframes were constructed for the modeled domains using Leapfrog 3D(tm) modeling software as well as Vulcan(tm). SRK modeled both the Pit and NE zones independently, and corrected inconsistencies with the Leapfrog solids using Vulcan.
The average sample length for all samples is 1.44 metres. Samples were composited to 3 m lengths within the breccia, stockwork, and PC zones. For the estimation, SRK used Ordinary Kriging in the densely-drilled areas and Inverse Distance Weighting for the areas with more widely-spaced drilling. SRK applied appropriate block model validation techniques for a resource estimation at this stage of project development.
Pit optimization was conducted using Whittle(tm) software and evaluating the block model which was constructed in Vulcan(tm). The purpose of the pit-optimization exercise is to satisfy the conditions of "reasonable prospects for economic extraction" as defined in the CIM Guidelines using pit shells based on a very simple "break-even" cash flow model. These pits are not representative of detailed mine plans or even the "best" pit design for the Project. A cut-off for the mineral resource of 20 g/t and 45 g/t AgEq for open pit and underground potential was used respectively.
Measured, Indicated and Inferred Mineral Resources are categorized as Measured being where at least 3 drill holes occur within a 25 metres ellipsoid, Indicated being where at least 3 drill holes occur within a 50 metres ellipsoid and Inferred being where at least 2 drill holes occur within a 75 metres ellipsoid. Blocks estimated using Inverse Distance Weighting in the widely-spaced drilling intermediate to the two primary zones are categorized as Inferred.
PROMONTORIO RESOURCE CALCULATION DETAILS
The following tables outline the calculation used by Sue Bird to determine the Promontorio resource estiamte.
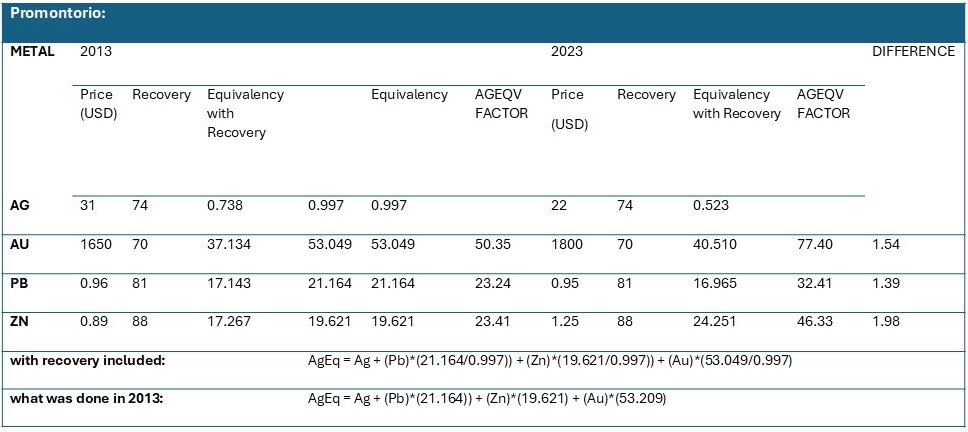

1. US$22/oz silver
2. US$1800/oz gold
3. US$0.96/lb lead
4. US$0.89/lb zinc
METALLURICAL TEST WORK
G&T Metallurgical Services Ltd, Kamloops, BC, Canada completed preliminary metallurgical programs on drill core composites from the Promontorio property for Kootenay in 2009, 2012 and 2013.
Several significant factors were noticed in SRK's review of the metallurgical process work conducted to date. The metallurgical program investigated a standard polymetallic sequential flotation flowsheet that includes:
- Crushing;
- Grinding;
- Lead Flotation;
- Zinc Flotation; and
- Pyrite/Arsenopyrite Flotation
Three rounds of metallurgical testing have been conducted on the Promontorio deposit and two rounds of metallurgical testing have been conducted on the La Negra deposit.
At Promontorio, overall gold recovery is estimated at 70% and is based on 65% gold recovery into the pyrite flotation concentrate followed by 94% cyanidation gold extraction from the pyrite concentrate after pressure oxidation, plus an average 9% gold recovery into the lead flotation concentrate. Economic Analysis in later sections assumes Lead and Zinc concentrate grades of 65% and 52% respectively. These are industry standard values in the range of the locked cycle test results.
GEOLOGY & MINERALIZATION
The claims lie on the western margin of the Sierra Madre Occidental rhyolite volcanic province, and occur in a wide NNW-trending zone of late-Tertiary (Neogene) extension. The listric normal faults have dissected and tilted the Tertiary rhyolite sequence and exposed a wide range of older rock types as inliers.
Geologic units in the immediate vicinity of the Promontorio prospect include basement rocks of Late Triassic, Late Cretaceous and Lower Tertiary age overlain unconformably by Late Tertiary volcanics and conglomerates. The basement rocks underlie the northern part of the Promontorio area and the Late Tertiary cover units, the southern part. The Project lies very proximal to the transition between the basement and the cover units. It is entirely hosted in the basement rocks. The regional distribution of the basement and cover is suggestive of a general southerly tilting to the area where the older rocks are exposed to the north.
The mineralization at Promontorio is recognized as being hosted in a diatreme breccia complex measuring roughly 3.5 by 1.8 km in size. This is an important geologic concept, as diatreme complexes have exploration potential and are known to host deposits of precious and base metals. Mineralization is centered on multi-stage breccias and peripheral stockwork zones within the diatreme complex. Drilling has concentrated on two areas of the diatreme complex that make up the current mineral resources, referred to as the Pit and NE zones.
The Pit and NE resource zones are locally open along strike and at depth and represent potential areas for resource expansion. The Pit and NE zones are the only two areas of known mineralized breccia or stockwork to be extensively drilled. Distal from these areas, there are several other areas of mineralized breccia or stockwork with limited or no drilling or are being currently drill tested that have similar geochemical or geophysical characteristics as the known mineralization of the Pit and NE zones.
Mineralized breccias and surrounding stockworks are further delineated by broader alteration and geochemical zones showing geochemical signatures such as strong sodium depletion and sulfur enrichment which are volumetrically larger than the mineralization and coincident with it. These geochemical signatures are currently being applied to assist in the delineation of additional mineralization in some of the satellite exploration targets.